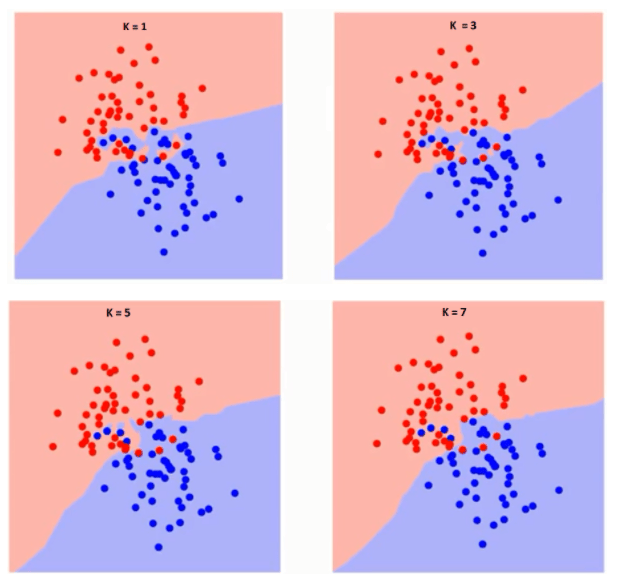
This post is a follow up from the previous post. I will work through an implementation from scratch in python.
The code is saved at my github.
The data
The data is a well known dataset related to features of Iris flowers, from the Iris Plants Database. It might be the best known dataset in classification literature, related to several classic papers. The data is here, and more info on the dataset is here.
The code
First, importing the dataset and having a look at the data.
# import required packages
from csv import reader
from math import sqrt

#create a simple function for loading csvs

def load_csv(filename):
    dataset = list()
    with open(filename, 'r') as file:
        csv_read = reader(file)
        for row in csv_read:
            if not row:
                continue
            dataset.append(row)
    return dataset

#identify the file name and load the data

filename = 'iris.csv'
dataset = load_csv(filename)

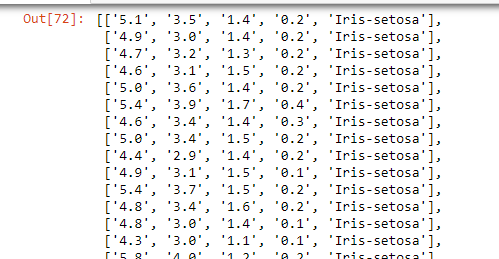
#view the data

#note it is all in string format and needs to be reformatted

dataset
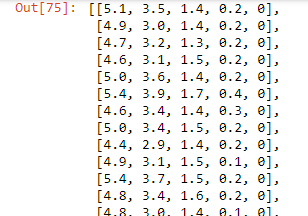
Then cleaning the data, converting strings to the correct formats.
# function to convert string column to float

#strip removed trailing and leading blanks
#float function converts to float

def str_to_float(dataset, col):
    for row in dataset:
        row[col] = float(row[col].strip())

#apply the formula to all but the last column

for i in range(len(dataset[0])-1):
    str_to_float(dataset, i)

#now need to clean up the categorical variable, convert it to an integer.

def str_to_int(dataset, col):
    #identify classes
    classes = [row[col] for row in dataset]
    #get distinct classes
    distinct = set(classes)
    #initialise dictionary of class values
    lookup = dict()
    #fill dict with integer for each class value
    for i, value in enumerate(distinct):
        lookup[value] = i
        print('[%s] = %d' % (value, i))
    #lookup into the dictionary, based on the string
    for row in dataset:
        row[col] = lookup[row[col]]
    return lookup

 #apply formula to last column

str_to_int(dataset, len(dataset[0])-1)
The algorithm
Functions to calculate euclidean distance, identify neighbours, and apply the algorithm to new data.
# Calculate the Euclidean distance
def euclid_dist(r1, r2):
    #initialise distance
    distance = 0.0
    #loop through rows
    for i in range(len(r1)-1):
        distance += (r1[i] - r2[i])**2
    return sqrt(distance)

# Locate the most similar neighbors
def get_neighbours(train, test_row, num_neighbours):
    #train is the training dataset
    #test_row is a single observation
    #num_neighbours is the predefined k value

    #initialise list
    distances = list()
    #loop through train rows
    for train_row in train:
        #measure distance betweeen test row and train row
        dist = euclid_dist(test_row, train_row)
        #add train row and distance to distances dataset
        distances.append((train_row, dist))
    #sort by distance
    distances.sort(key=lambda tup: tup[1])
    neighbours = list()
    #identify top k neighbours
    for i in range(num_neighbours):
        neighbours.append(distances[i][0])
    return neighbours


# Make a prediction

def predict_class(train, test_row, num_neighbours):
    #identify neighbours using neighbour function
    neighbours = get_neighbours(train, test_row, num_neighbours)
    #keep the class variable
    output = [row[-1] for row in neighbours]
    #assign the most common category as the prediction
    prediction = max(set(output), key=output.count)
    return prediction
and then applying it to a single new input!
# define k
num_neighbours = 5
# define a new record
row = [4.3,1.1,2.2,1.1]
# predict the class
label = predict_class(dataset, row, num_neighbours)
print('Data=%s, Predicted: %s' % (row, label))

Testing the accuracy of the algorithm
import random

random.shuffle(dataset)

train_data = dataset[:120]
test_data = dataset[120:]

num_neighbours = 5

correct = 0
for i in range(len(test_data)):
    y = predict_class(train_data, test_data[i][0:4], num_neighbours)
    if y == test_data[i][4]:
        correct += 1
    print(y, test_data[i][4])

29 out of 30 correct classifications in the test dataset. Not bad!