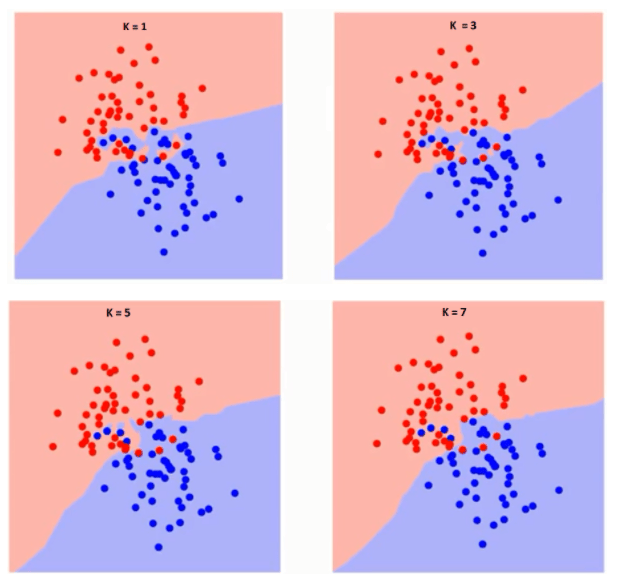
k-Nearest Neighbours (k-NN) is a non-parametric classification algorithm that has been around since the 50’s. It is typically used for classification, but can also be used for evaluation. With classification, a data point is compared to the k observations closest to it, and the classes of those observations infer the class of the data point. With regression, the same approach is taken, but the mean of the regression variable is used as the inferred value for the data point. Classification is the more common use.
The measure of distance used to identify neighbours is important, as is the scales of the variables involved – if they vary significantly then standardisation can help with accuracy. Finally, weights are sometimes applied to the neighbours, with nearer data points carrying more significance.
How The Algorithm Works
The training dataset consists of multidimensional vectors, each with a class label.
The classification dataset is an unlabeled vector. With a user-defined k, the unlabeled vector is compared to its k nearest neighbours. For classification, the unlabeled vector gets the mode label from the k nearest neighbours. For regression, it gets the average of the k nearest labels.
Distance Metrics
The most commonly used distance metric for continuous variables is Euclidean Distance. In n-dimensional space the formula is:

For discrete variables, including text classification, metrics like the Hamming Distance can work.
Choosing K
Choosing k depends on the data. Larger values of k can reduce noise, but the boundaries between classes can become complicated. Choice of features can also introduce significant noise: having irrelevant or unimportant features in the data degrades the algorithm’s performance. Feature selection and feature scaling can help with optimisation.
Running the algorithm at different values of k will allow for error rate inspection and optimal parameter choice.
Examples
Here’s a simple example that does calculations by hand.
Here’s a blog post with a from-scratch implementation in python.
Here’s a great blog post from analyticsvidhya.com with python and R implementation, and some nice graphical examples.